Understanding how sales analysis works is essential for any business aiming to measure performance and improve operations. Knowing what sells, how it sells, and who buys it gives decision makers a clearer view of market trends and internal strengths.
This article explains the key steps of sales data analysis, the main methods used in evaluating performance, and how EZ Integrated and its partners support this process.
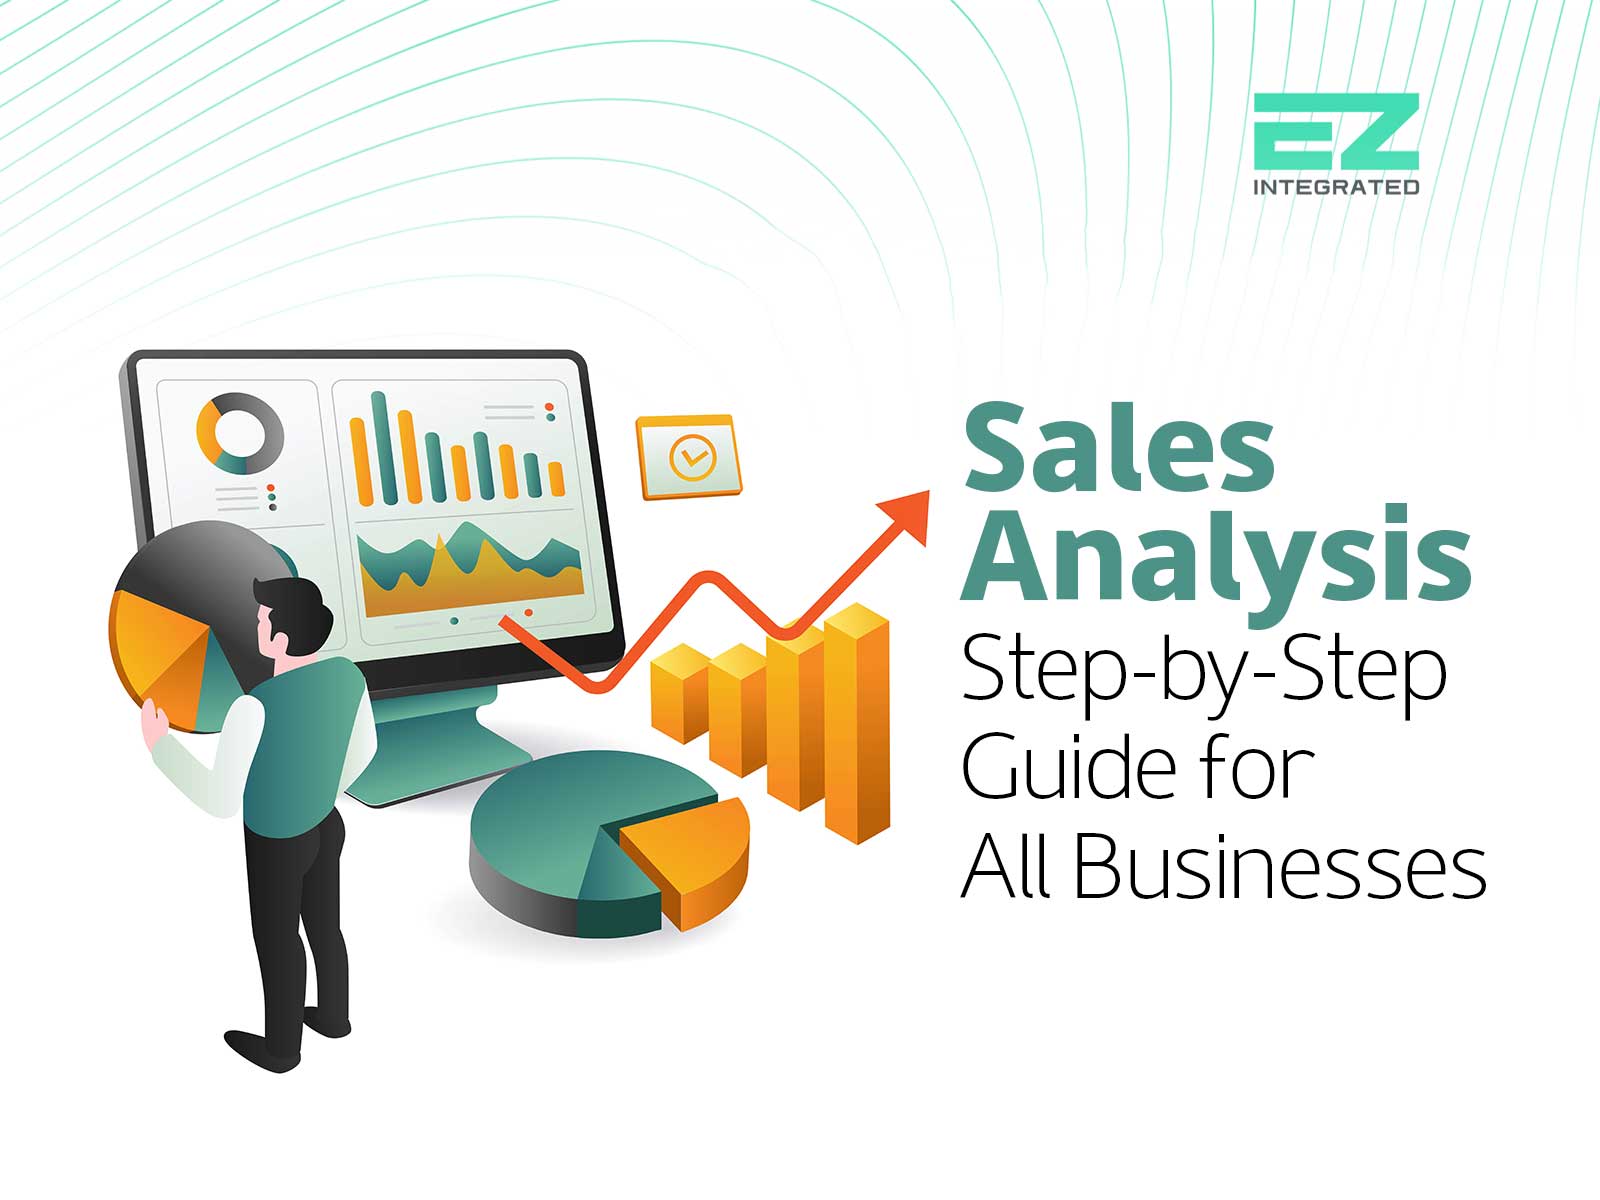
What Is Sales Analysis and Why Do Businesses Rely on It?
Sales analysis involves studying data from sales operations to understand performance patterns. This process helps evaluate products, identify trends, and discover improvement opportunities. It also supports financial planning and long-term growth strategies while improving customer service.
Why Should Every Business Master Sales Analysis?
Mastering sales analysis gives businesses the ability to:
- Improve pricing and commercial planning
- Understand customer behavior and needs
- Identify high-profit and low-performing products
- Control inventory levels and reduce waste
- Measure the performance of branches or sales channels
This helps ensure decisions are based on clear data instead of assumptions.
Also read: Main Types of Financial Resource Management Software
Sales Analysis Steps: A Clear and Practical Breakdown
Sales analysis depends on several connected stages that help businesses interpret data correctly and build decisions on solid foundations.
1. Define the purpose of the analysis
The process starts by setting a clear goal such as increasing revenue, improving product profitability, or addressing weak performance in a branch. Clear goals make the analysis more focused and useful.
2. Collect data from reliable sources
Effective sales analysis depends on accurate data. Key sources include point-of-sale systems, e-invoices, inventory levels, and stock reports. Complete data leads to more reliable results.
3. Organize and categorize the data
Data is then classified by product, category, date, branch, or customer type. This classification provides deeper insights into performance and reveals trends across different periods.
4. Apply sales analysis methods
Common methods include:
- Identifying best-selling and low-selling products
- Analyzing true profitability for each category
- Measuring branch or channel performance
- Comparing monthly or yearly results
- Tracking seasonal demand trends
5. Interpret results and draw conclusions
Interpreting the numbers helps turn insights into action. A rise in sales may indicate strong demand, while a decline may reflect issues in pricing, marketing, or stock availability.
6. Make data-driven decisions
Results are translated into actions such as adjusting prices, increasing stock for specific seasons, launching targeted promotions, or reorganizing the product mix.
Most Common Sales Analysis Methods
Businesses use several approaches to read sales performance, and each method offers a different perspective:
- Product-based analysis
- Customer-based analysis
- Branch or location-based analysis
- Time-based and seasonal analysis
- Predictive analysis using historical data
Also read: Best Inventory Valuation Methods for Saudi Companies
Common Mistakes in Sales Data Analysis
Several errors may lead to misleading results, including:
- Using incomplete or outdated data
- Ignoring seasonal or economic impacts
- Focusing on revenue without considering profitability
- Conducting analysis without linking it to an action plan
How EZ Integrated and Its Partners Support Sales Analysis
Accurate sales analysis requires complete and reliable data. EZ Integrated provides technical solutions that help businesses enhance the quality of their sales data through:
1. Integrating accounting systems and supporting e-invoicing through EZ Integrated
EZ Integrated connects the business accounting system with the FATOORA platform to ensure smooth and accurate transfer of tax data. This integration improves the accuracy of sales records and builds a trusted foundation for analysis.
2. CODEIT POC Program for capturing and analyzing sales data
CODEIT point-of-sale program collects real-time sales data from all branches. It offers analysis tools and dashboards that highlight demand trends, product profitability, and branch performance. This data is then shared with the accounting system for a full analytical view.
To improve sales management and strengthen the connection between financial data and e-invoicing, you can contact the EZ Integrated team to receive guidance on choosing the technical solutions that best match your operational needs.